top of page


ON-FARM SAVVY™ — BIOLOGICAL INTELLIGENCE FOR BROILER PRODUCERS
The next performance advantage is biological
Get more from your genetics, nutrition and production systems by understanding how your birds respond, and where improvements can deliver the greatest economic return.
ON-FARM SAVVY™ brings comprehensive, performance-linked Biological Intelligence into commercial broiler production, helping producers understand what drives performance, quantify the economic significance of biological constraints and prioritise improvements across their operations.
01 — KNOW WHAT'S DRIVING YOUR PERFORMANCE
Same genetics. Same feed. Different performance. Why?
Every broiler operation invests in genetics, nutrition and management to improve performance. But the biological response of the bird ultimately determines how effectively those investments are converted into growth, and why flocks perform differently, even under similar production conditions.

02 — THE MISSING BIOLOGICAL LAYER
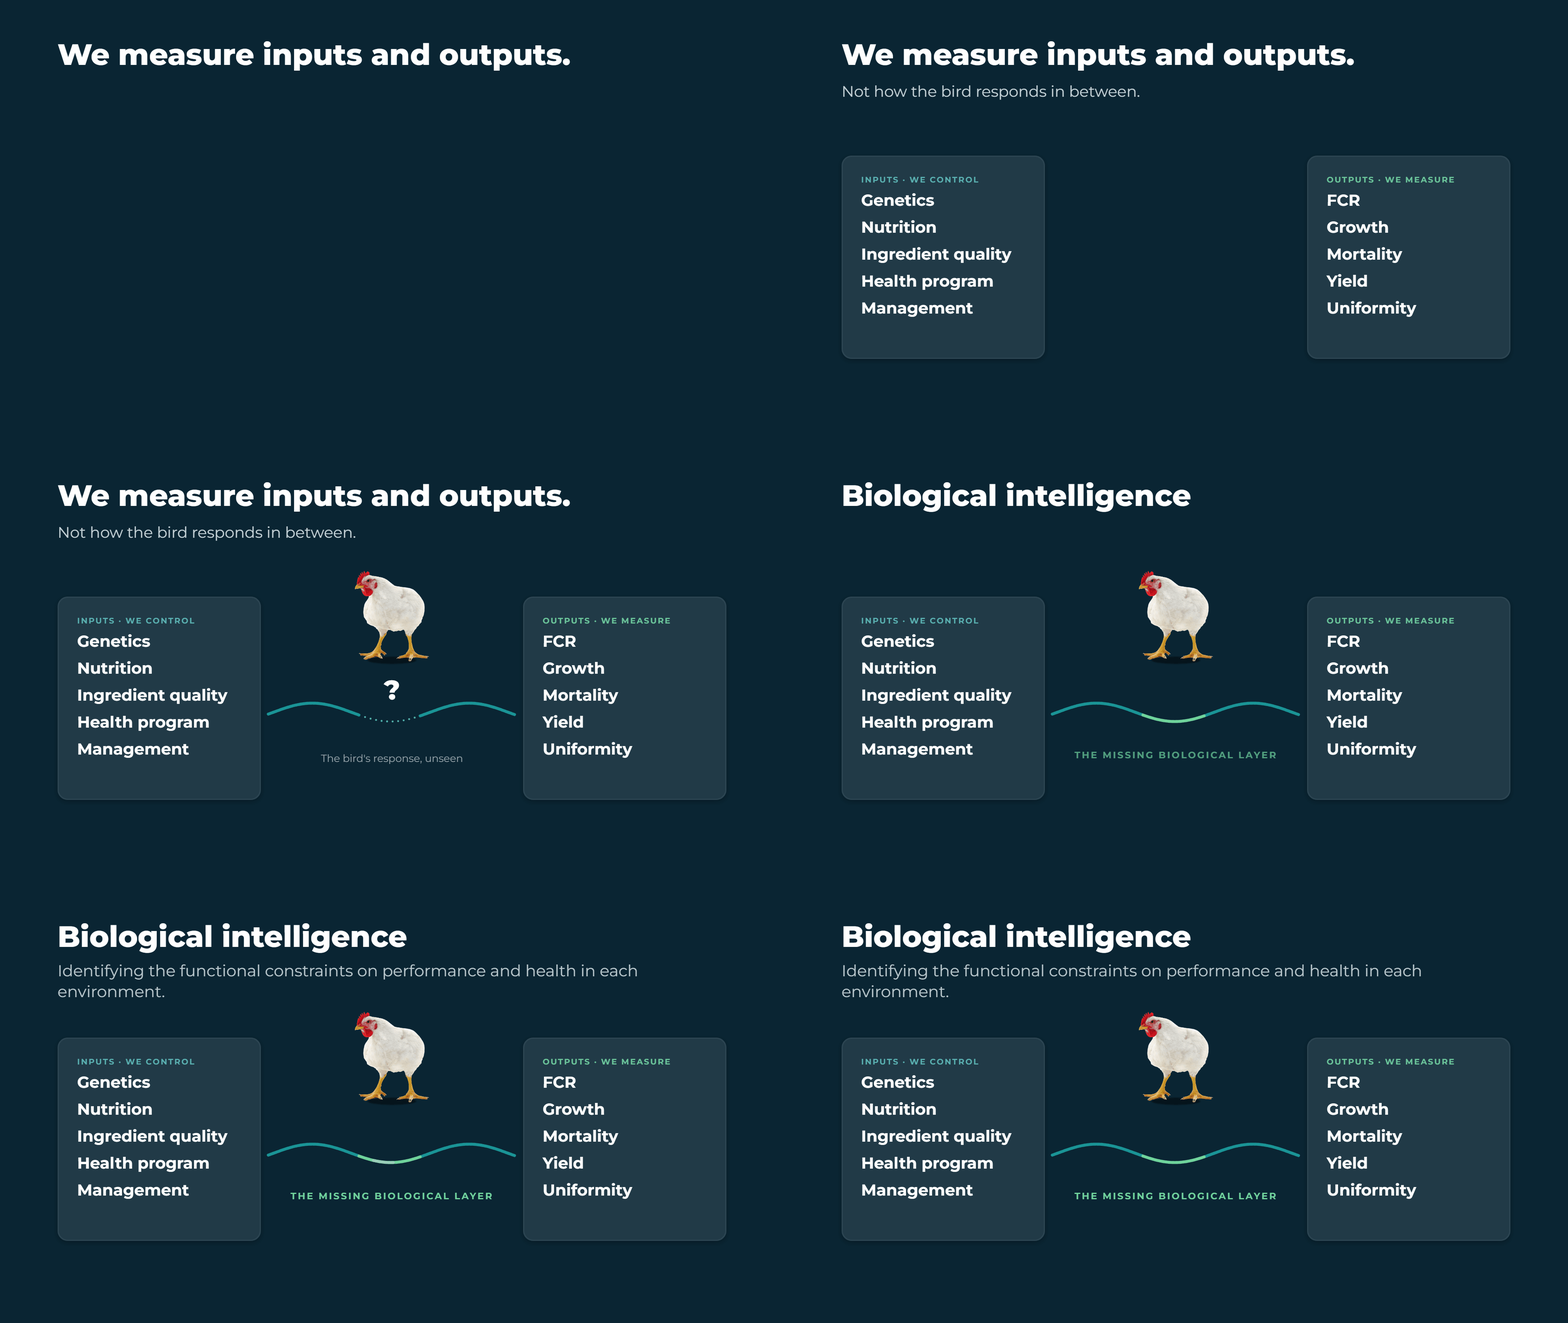
ON-FARM SAVVY™ reads the bird's biological response:
the layer between what you put in and what you measure out.
03 — WHAT ON-FARM SAVVY™ REVEALS
A comprehensive assessment of the bird's biological response
AI-driven transcriptomics assesses more than 250 biological pathways simultaneously, explaining performance differences through the interconnected biological systems influencing feed efficiency, growth and resilience.

One number for biological performance and what's behind it.
The Biological Performance Index (BPI) is a consolidated, performance-linked measure of how your flocks are responding biologically, benchmarked from −100% to +100% against a reference, and linked to predicted adjusted FCR.


Predicted FCR impact: see what the biology is costing in feed efficiency, in points of FCR versus a reference farm.
Challenge models: predictive scores such as coccidiosis challenge, from low to clinical.
04 — FROM INSIGHT TO ACTION
From Biological Intelligence to economically informed decisions
01

Baseline
Compare farms and cycles to understand what differentiates the best-performing flocks.
Baseline
02
Detect
Baseline
Baseline
Identify the biological constraints limiting feed efficiency and rank them by their estimated contribution to FCR.
03
Act
Prioritise targeted nutritional, and management intervention strategies by their potential return.
04
Verify
Repeat sampling evaluates the biological, production and economic outcomes of each strategy.
CYCLE AFTER CYCLE
Move from understanding biological limitations to deciding where to intervene, what to prioritise and how to allocate resources, and focus improvement efforts where they can deliver the greatest value.
05 — EVIDENCE FROM COMMERCIAL FARMS
The Biological Performance Index: A measure of functional health linked to feed efficiency
Independent histopathology validation:
higher BPI, lower tissue pathology score in jejunum
Commercial FCR validation:
lower BPI at 24–28 d, worse adjusted FCR at harvest


* Veterinary Diagnostic Pathology Laboratory. Cumulative pathology score
Two US commercial broiler complexes, 4 farms each, 8 birds per farm, jejunum sampled at day 24–28.
06 — HOW THE SERVICE WORKS
Make Biological Intelligence part of how you produce
A practical, scalable service, designed to improve performance consistently across the operation without adding complexity to production teams or farm routines.

01
Define the farms, cycles and production comparisons that will show the greatest improvement opportunities.
Plan your sampling
02
Receive kits
Baseline
Sampling kits with prelabelled tubes, RNA stabilisation reagent and sampling instructions.
03
Collect and ship samples
Ambient-temperature shipping, with logistics included and Biofractal support.
04
Laboratory analysis
RNA sequencing, followed by AI-driven analysis of more than 250 biological pathways.
05
See what drives performance
BPI results, ranked constraints, economic impact estimates and comparative analyses in the SAVVY™ platform.
06
Turn insights into improvements
Technical support to translate results into practical improvement opportunities, and repeat sampling to evaluate the response.
07 — THE CUSTOMER EXPERIENCE
Biological Intelligence,
accessible when you need it
A repeatable, evidence-informed approach to improving production efficiency.

BPI results across farms and cycles
Biological constraints ranked by contribution to FCR
Economic impact estimates
Comparative analyses and scientific support
08 — A COMPETITIVE EDGE
Understand where the greatest returns lie
ON-FARM SAVVY™ connects intestinal function to economic impact, helping your team prioritize nutrition, health, and management decisions that improve margins.
Track the response over successive cycles to reduce performance variation and drive continuous improvement.


bottom of page